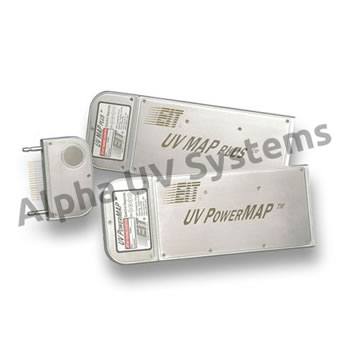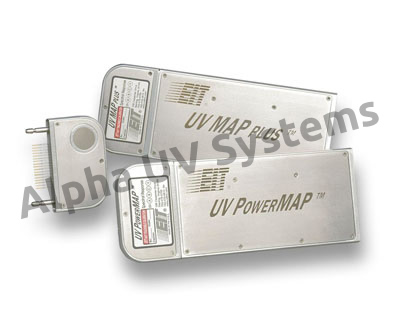

The UV PowerMAP® and UV MAP Plus™ measure UV irradiance, radiant energy density and temperature. The UV PowerMAP® simultaneously provides information for four spectral regions (EIT UVA, UVB, UVC, and UVV) while the UV MAP Plus™ provides for any one spectral region. Both instruments also provide a plot of the UV irradiance and temperature as a function of time.
Click on Tabs below for Additional Product Information:
Features
Both the UV PowerMAP® and UV MAP Plus™ feature:
|
Applications
Possible applications for both the UV PowerMAP® and UV MAP Plus™ include:
|
Overview
General Overview of UV PowerMAP® and UV MAP Plus™EIT’s UV PowerMAP and UV MAP Plus are advanced profiling systems that measure and store UV energy density, UV irradiance, and temperature information derived from their optics and thermocouple probes in UV curing processes. The UV PowerMAP simultaneously measures all four UV channels while the UV MAP Plus measures one channel. The information is transferred to a PC where it is presented in graph and data format for viewing, analysis manipulation and comparison. The information is characteristic of the same energy and irradiance that would be impinged on an actual work piece passing through the curing process. The UV PowerMAP and the UV MAP Plus are essential tools for developing, documenting, monitoring, and maintaining UV curing processes. Formulators and suppliers (raw material, equipment, UV systems, substrates) can easily monitor the process conditions and speed the transfer from the laboratory to a production environment. Communication, sharing and the transfer of system information both within a company and between different companies can be done very easily with the PowerView files that are generated with this measurement system. The UV PowerMAP provides information on one to four UV bandwidths and is most useful for industry suppliers, R&D applications and customers with additive (mercury-iron, mercury-gallium) bulbs. The single channel UV MAP Plus was designed for use on a production floor, and it is an economical alternative to the UV PowerMAP. The UV PowerMAP and the UV MAP Plus offer two distinct advantages over previous mapping systems:
The user inserts the unit into a stationary or conveyorized UV process for data collection in the same manner that an actual work piece would be inserted. The unit’s low, narrow profile of only 0.5”H and 3.5”W allows usage in a wide range of demanding physical environments. The unit’s optics are offset so it can collect data at the ends of the bulbs where lamp degradation tends to occur first. Upon exiting from the curing environment, the unit is connected to a PC serial port via cable so that the “run” information can be uploaded into the PowerView application software. Unit OperationA Type J thermocouple probe is used for substrate temperature measurement. Temperatures from 0o to 500oC are recorded at 32 samples per second. This is an important function if curing is taking place on temperature sensitive substrates. The UV PowerMAP and the UV MAP Plus are powered by nickel hydride (NiNH) batteries, which can be recharged approximately 500 times before needing replacement. An audible alarm sounds when the batteries need recharging. Routine maintenance for the units consists of battery charging, cleaning, and returning the optics head for routine calibration. Recharging is accomplished by a one-hour “quick” charge. Keeping the optics clean is essential for getting proper measurement results, and it requires only cotton swabs and acetone. The case can be cleaned with isopropyl alcohol and a soft cloth. Since the optics head disconnects from the DCU, only the optics head has to be returned for periodic calibration. It is connected to the collection unit by two mechanical pins and a row of electrical contacts, and locked into place by two setscrews. Another optics head may be purchased to avoid down time during recalibration or to upgrade from single to four-channel capability. Five areas where the PowerMAP System excels:
SummaryThe UV PowerMAP and the UV MAP Plus have an enormous advantage over other UV measurement instruments on the market. Both allow the user to evaluate the entire lamp system to see how well it delivers UV light to the actual cure surface. The collected data allows the user to adjust the curing process to ensure that the UV system is operating at maximum efficiency. The data that is graphed can be archived for future reference or printed and attached to work orders for ISO or FDA compliance. |
PowerView Software
General Overview of PowerView™ software | |
PowerView™ is a Windows based LabView program written at EIT to work with the UV PowerMAP and the UV MAP Plus systems. PowerView has evolved as the Windows platform has changed. Contact EIT to match PowerView to your Windows platform.
The data collected with the radiometers is transferred through the serial port of the computer to the PowerView program. The data is available for viewing on the computer screen. Included with the data is information on the collection instrument as well as a time/date stamp. The user can add several lines of information to the PowerView file. This allows process, equipment and formulation variables to be stored with the file which is especially useful when running trials or doing R&D work. The information collected can be saved and accessed later for comparison to another file. The data and files can be analyzed, manipulated, customized, printed, emailed and even exported into a spreadsheet program if needed.
PowerView shows the status of a curing system in a clear, easy to read format. The user can see which lamps and reflectors in a system are well focused and performing most efficiently. PowerView’s ability to compare two different runs is one of its most important features. The run data files are referred to as a “sample” file and a “reference” file.
Variables such as reflector materials, reflector shapes, wavelength-specific reflector degradation and uniformity, and lamp focus can be documented. Companies using multi-lamp curing systems and those that are using different spectral lamps within a system will find these radiometers indispensable.
PowerView Set Up Screen
The UV PowerMAP and UV MAP Plus are initially configured at the factory before they are shipped. Instrument configuration and computer communication settings are easily viewed and changed in the Set Up screen. The user can set the unit’s configuration (enabled UV channels, sample rate, time/date stamp, over temperature alarm) to best match lamp system parameters. Estimated data time is displayed based on how the instrument is configured. The maximum available collection ‘time’ varies (2 to 60 minutes) on how the unit is configured. Newer versions of PowerView also allow printer and language selections to be made.
PowerView Transfer View Screen
The data transfer from the UV PowerMAP and UV MAP Plus is initiated in PowerView’s Transfer View screen. Estimated time and a progress bar are shown as the data from the instrument ‘transfers’ into PowerView. A preliminary view of the plot is available during transfer, which allows the user to stop the transfer once the unit has passed all UV lamps of interest. This helps to keep file sizes small. During the transfer, many users elect to enter information such as line speed, amp readings, lamp settings, types of bulbs, and any other information relevant to the run.
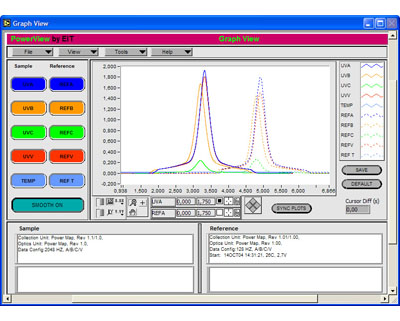
PowerView Graph View Screen
PowerView’s Graph View screen plots the UV irradiance and temperature (y-axis) data as a function of time (x-axis). The user can toggle ‘on’ or ‘off’ the temperature or any of the available UV channels. Graph View’s comprehensive tool menu allows you to scale the plots as well as zoom in/out on any portion of the plot such as a peak on a system. Cursors allow the user to break down any portion of the graph for individual analysis as well as overlay two files on top of each other for direct detailed comparisons. The user can also print the graph, change the appearance/color of the plotted curve, and apply a data-smoothing filter.
PowerView Data View Screen
The Data View screen lists the total radiant energy density (J/cm²) and the irradiance (W/cm²) for each active spectral channel. The average temperature and peak temperature readings collected by the thermocouple are also presented. If two files are open, Data View shows the difference between readings as absolute values and as percentages. Logged information and user-entered information is also displayed for both run files.
Specifications
Electrical Specifications | |
| Configuration | Two-parts: Detachable Optics Block (DOB) and Data Collection Unit (UDC) DOB: Supports optics to measure one (UV MAP Plus) or one-four (UV PowerMAP) UV spectral bandwidths UDC: 256 bytes non-volatile memory |
| Instrument Dynamic Range | High Power: UVA, B, V - 200mW to 20W/cm²; UVC - 20mW to 2W/cm² Low Power: UVA, B, V - 2 to 200mW/cm²; UVC - 1 to 100mW/cm² |
| Spectral Response | UVA (320-390nm), UVB (280-320nm), UVC (250-260nm), UVV (395-445nm) |
| UV Accuracy | +/-5% typical, +/- 10% maximum |
| Temperature Measurement | Type J; Input Range: 500°C Maximum (thermocouple range determined by thermocouple wire used. 250°C thermocouple wire supplied with unit); Sample rate: 32 samples per second |
| UV Sample Rates | User-adjustable from 128 to 2048 samples per second |
| UV Sample Period | Maximum of 1 hour, determined by configuration-sample rate, enabled bandwidths |
| Operating Temperature Range | 0-70°C internal temperature; over-temperature alarm @ 65°C |
| Unit Operation | One push button switch |
| Indicators | One single tone audible indicator; Dual-color LED (Red/Green) |
| Battery | Nickel metal hydride (NiMH) |
| Battery Cycles | 500 typical |
| Charging Period | One hour quick charge at temperatures below 35°C |
| Charging Adapter | AC input: 100-130VAC, 50/60Hz or 200-240VAC, 50/60Hz DC output: 12 VDC @ 250mA |
| Operating Time | Determined by unit configuration, collection time and data transfer speed. Guideline: A two-minute sample period with all four channels enabled at 512 samples/second yields 30+ readings on a single charge. |
Mechanical Specifications | |
| Unit Dimensions | 3.50”W X 9.0”L X 0.5”D (8.89cm X 22.86cm X 1.27cm) |
| Weight | 20.2 ounces (570 grams) |
| Materials | Aluminum chassis with stainless steel covers |
PowerView Software | |
| Interface | Windows-based fully graphical interface |
| Version 2.0 software | Written for Windows 2000/NT, often works with XP/Vista platforms. Available CD only; also requires installation of Lab View’s Run-Time software (included on CD). Version 2.0 offers printer and language selection. |
| File Format | Data files stored as .eit files; size depends on the amount of data collected. File formats between older Version 1.0 and Version 2.0 files are different. Version 2.0 is able to read and convert 1.0 files to the 2.0 format. Version 1.0 cannot read Version 2.0 files |
| Note: Specifications are subject to change. | |
Search in Shop
Recently viewed:
-
EIT UV PowerMAP & UV MAP Plus
Notice: Undefined property: stdClass::$prices in /home/alphauvc/public_html/templates/rt_nuance/html/mod_virtuemart_product/default.php on line 115
Call for price
Notice: Undefined property: stdClass::$prices in /home/alphauvc/public_html/templates/rt_nuance/html/mod_virtuemart_product/default.php on line 83